

Unified Star Schema - Part 3
Final thoughts


This is the final post of a three part series on the Unified Star Schema (USS) by Bill Inmon and Francesco Puppini. You can use the link and discount code at the end to get a copy, which I recommend!


Last week, I covered the core concepts of the USS, including the Bridge and how it resolves some common Business Intelligence problems.
Self-serve and ad-hoc analytics
The USS really shines for self-serve, where the SQL is hidden from the user. It increases the connectivity of the datasets that can be used, it eliminates data loss and it eliminates inconsistent and incorrect results from duplication driven by fan outs and chasm traps. As
showed in our recent post: it’s possible right now to offer querying using the USS, using a semantic layer. This hides the technical implementation detail of the USS from a non-technical user, but still gives them all the benefits.The USS may not make ad-hoc querying for skilled SQL analysts that much easier, as it’s a bit counter-intuitive to use. These analysts would already know how to avoid chasm and fan traps and choose join direction for their queries, as I did last week. However, it is possible that if they really become accustomed to the USS, they could write ad-hoc queries in this way and have more confidence about quality sooner. They may not need to do as much QA to ensure they haven’t accidentally fallen into a fan or chasm trap. It might be easier to have a standard template for an ad-hoc query that they then simply adjust and remove parts from, without needing to specify any joins and possible pre-aggregation steps each time.
There are also many analysts, especially at larger enterprises, who are not code-first analysts. Many don’t actually know SQL well - they are more familiar with presenting data already available to them in Excel or a BI tool. For these analysts, the USS, which they need not even be aware of, is a huge boost. The extra connectivity: no need to have data siloed in small data marts, unable to be analysed together. The extra functionality of being able handle queries which may have caused fan outs or chasm traps before. Code-first analysts can debug their queries when results look strange - these analysts often have to check other systems or ask for help, and anything which so hugely reduces the chance of incorrect numbers is a big help to them.
Data and Analytics Engineering Concerns
The USS eliminates the need for small simple data marts to be created - the only problem is that too much is available from the Bridge, as it’s the whole data model. Marts could just be subsets of a main USS where RBAC determines the objects in the subset based on user privilege - therefore dynamic marts based on the user. Alternatively, AI could be used, on a large USS exposed via a semantic layer, without too much of a problem and therefore concern around too much optionality for users is mitigated.
Where you have one large USS for almost all of your data, made accessible behind a semantic layer with APIs, it can also enable Data Scientists and ML Engineers to easily retrieve a dataset they need via an API call, to then use in a notebook or ML pipeline. Previously, because of the dangers of fan-outs and chasm traps, they would be more likely to deal with the raw datasets and join them together using Spark/Pandas/Dask etc. Having a comprehensive, trustworthy way to make easy data requests via API is a compelling prospect for these teams, as can be seen by the rise of specialist feature store software like Tecton and Feast.
Testing the USS is simpler than with other data models, referential integrity is very straightforward as tables joining the Bridge must have unique primary keys, and foreign keys that must exist in their respective tables. As long as this is true the USS will function without duplication. All concerns regarding chasm traps and fan outs driven into subsequent analytic queries in dashboards etc are gone.
As you can tell, I believe that adopting the USS will save money in terms of TCO of a data org. If it doesn’t save you money purely on data warehouse compute, it will definitely drive savings in terms of data team size and time.
Further Benefits
The USS enables multi-fact queries with ease in just one query, whereas multi-fact queries are difficult in one shot using Snowflake schemas, because of possible chasm traps. Star Schemas avoid the issue entirely by having only one fact table in each schema, leading to data silos. In fact, my example last week for using the USS to overcome the chasm trap, which I have shared again below, is an example of a multi-fact query. It is able to have a measure from orders and a measure from shipments - two fact tables in one query.
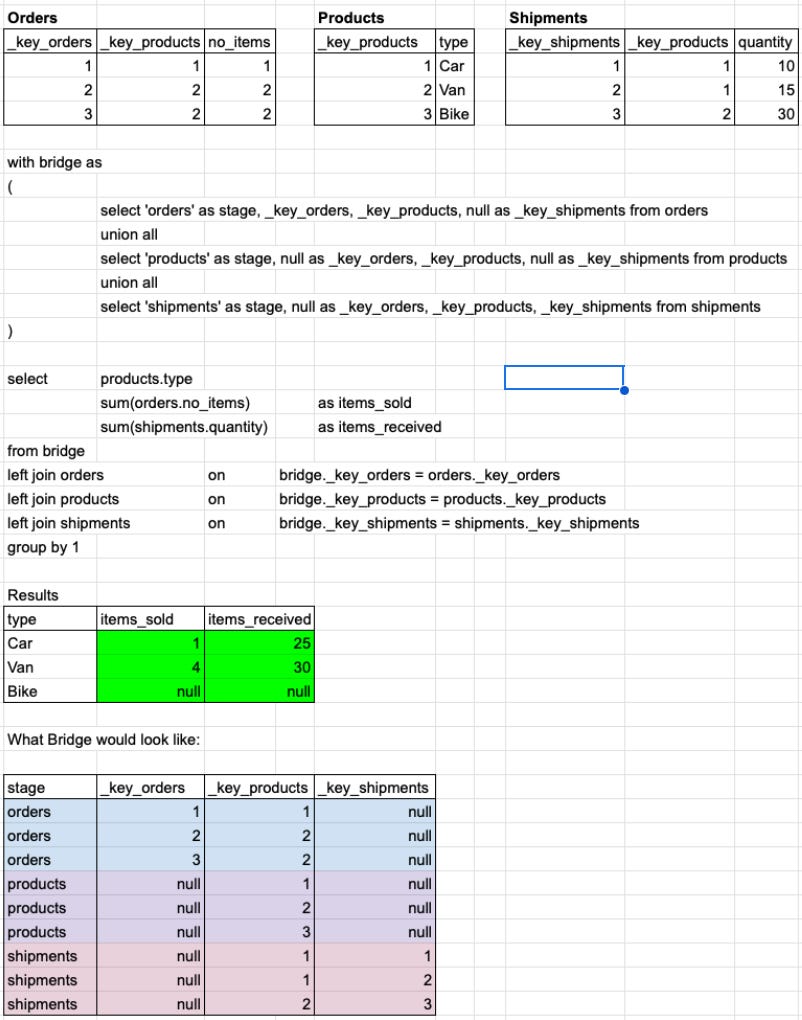
Many of us are familiar with these multi-fact queries, having seen them before in Looker as merge queries. Looker handled multi-fact queries by taking single fact queries, grouped by common dimensions, and joining the results from two or more such queries on these dimensions. It allowed business users to build these merge queries, which easily and often resulted in incorrect results - causing a wild west of different numbers. With the USS, a BI tool doesn’t need to allow this kind of risky feature - it is already solved by the data model.
The USS also solves for multi-fact better than the merge query approach: as you can see above, we get a row for Bike which has no orders or shipments. Using merge queries in Looker, results like this would have been filtered out by the pre-aggregation step of generating the single fact queries - which would have had no returned results for Bike and therefore none to return in the merge query. Of course, in instances where you don’t want the rows which are null for all measures, it’s easy to simply filter these out afterwards - it’s much better to have them available in the first instance!
Merge queries in Looker were often used to have multi-fact results where the common dimension was date, rather than some categorical dimension like in the example above. Just as Bike would have been filtered out in the example above, any date with no results from either fact table would also be filtered out of a merge query where the common dimension is date. Often data teams would solve for this by creating date tables which have all available dates to create a date spine. The single fact queries would then be grouped by the date spine, and then the merge query would be joined on the date - as you can tell, this is somewhat painful.
With the USS, you can include a dates dimension table in the Bridge and then have multi-fact queries with date spine in a single-shot query!
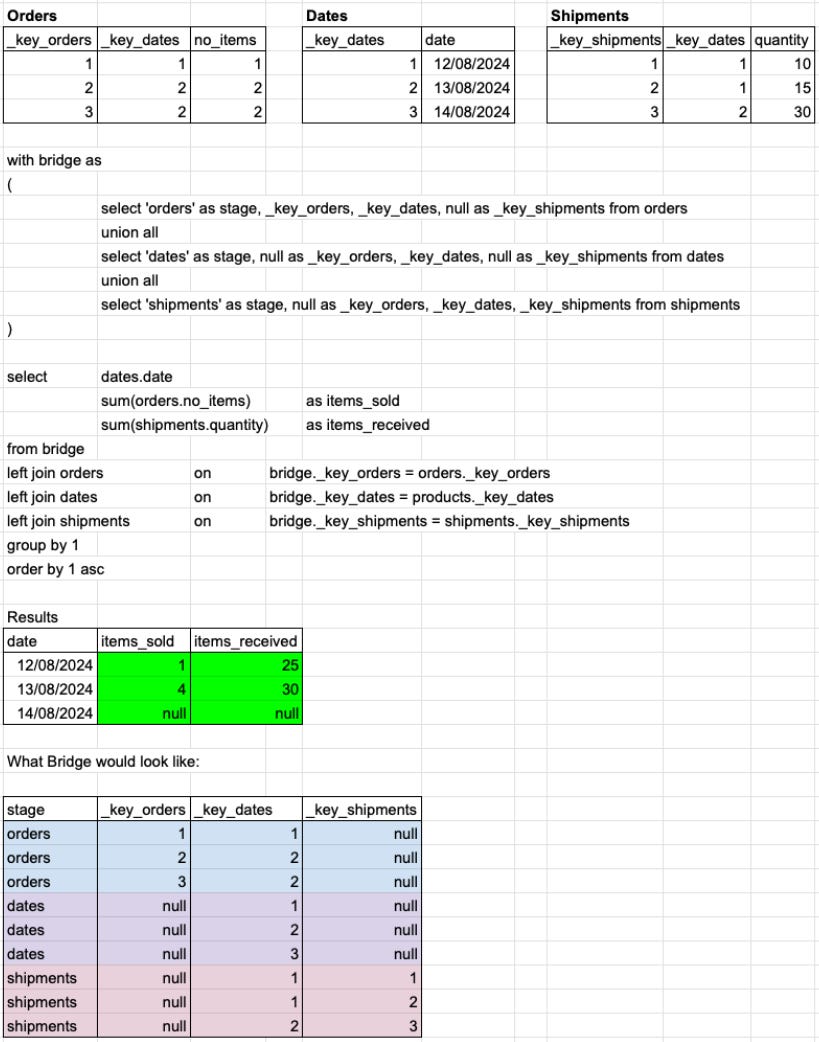
As you can see, the query is very similar to before, which is a good thing from a reusability standpoint. In fact, if we didn’t construct the Bridge on the fly each time, we wouldn’t have needed to change that part. You can also imagine that, with a BI tool or semantic layer, the only thing that would be changed is to request the date dimension instead of the product dimension.
Features like supporting multi-fact and date spine queries are enterprise BI features that BI tools have to solve in complex ways, that are now resolved by the data model. Any complexity removed from BI usage and asset creation will improve the experience of self-service users.
I also considered how easy identity resolution is with the USS. A Bridge can be constructed and then foreign keys can be filled in over time as data engineers learn where they exist. Just the fact that they are input into the Bridge enhances identity resolution - no other transformation steps are required.
A few things to bear in mind
As you will read in the USS book, the Bridge is a union of tables - they are not joined together. Sometimes teams have written SQL, semantic layer or BI code that relies on the filtering that joins cause. The Bridge is reduced rather than filtered and this can have some consequences to existing definitions in code. For example, if you rely on null states in dimensions or measures, the behaviour of your existing code may change.
If you were to define a measure like this: sum(case when orders.no_items < 5 then 0 else 1 end) as large_orders, it would most likely come up with a higher number using the USS than typical joins which filter. orders.no_items is null for the whole Bridge when joined in, except for rows in the orders Stage - in a typical query where joins filter the results, it will only be null on some of the records of one of the tables joined.

This is by no means an insurmountable problem: you could either add a condition to your logic to filter unwanted records (eg where stage = ‘orders’), or change your logic to not rely on null states (which is recommended anyway - it is better to be explicit). sum(case when orders.no_items < 5 then 1 else 0 end) as small_orders gives a result of 3, which is correct.
With self-serve BI and semantic layers, an analytics engineer is usually defining the metrics in code, so this extra care is an acceptable overhead for the benefits of the USS. I know the example above is contrived, but I have seen people write code like this before!
Another thing to bear in mind is where, in a non-USS query, you would have resulted in a chain of joins to use a field. So let’s say: order_items >- orders >- customers. Order items would have _key_orders as foreign key and this would be in its Stage. However, it may not have _key_customer as it is not needed in the data model, given Orders does have it. If you wanted to have a calculated field based on fields from order_items and customers, eg something like how many of the items a customer bought were sourced locally, the USS wouldn’t naturally be able to handle this, as the order_items Stage wouldn’t be able to join to the Customers table.
This can be solved by purposefully bringing _key_customers into the order_items Stage during creation of the Stage by joining order_items to orders. Again, it’s not so hard to solve this problem, but it requires a bit of thought about how the USS will be used, or how to adapt it as needs change.
It doesn’t feel like the problems the USS has are material, compared to the chasm-sized ones with other data modeling methods.
Conclusion
I have not covered all of the concepts in the book - including the benefits of how the USS deals with loops and non-conformed granularities, which are definitely worth a read!
I have never heavily dived into a specific method of data modeling before. It’s not that unaware of them, it’s that I always felt they had trade-offs that made it hard to recommend any given one. It made more sense to be flexible.
With the USS, I don’t feel this way. If the only real challenge of how and where you construct the Bridge is solved in your given circumstances, and I believe it can be, it’s beginning to feel like a no-brainer to use. Even if it wasn’t possible to efficiently maintain the Bridge, and for your gold datasets you needed to recreate the Bridge fully every day or hour, it is almost certainly still worth it for all of the benefits it offers. As the Stages are constructed from a few columns per table in the schema, with columnar databases, even taking all the keys for a large table will only scan a fraction of the full data.
I have never seen a data model so powerful for self-service BI. If you work in data, I recommend that you learn this data model and consider implementing it.
The publisher of the Unified Star Schema, Technics Publications, have kindly shared a discount code “TP25” to purchase the book directly from their site. This way you get the book and the electronic PDF copy for less than just the book on Amazon!
London Analytics Meetup #7 is also scheduled for 17th September, which is the evening before Big Data London 2024. Francesco Puppini will be speaking - don’t miss out!
Sign up for the meetup here.